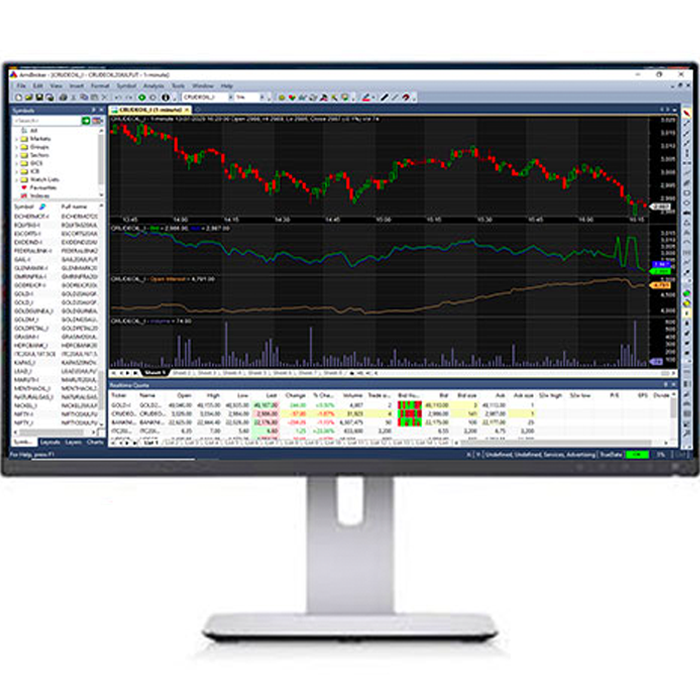
Real-time charts, streaming spreadsheets, live corporate announcements — all in one workspace.
Get started free
Corporate Data API
Real-time results, fundamentals & corporate actions
News API
Live market news feed
Call Support
+91 7304-22-44-66Technical / Billing Support
[email protected]For Partnering With Us
[email protected] 
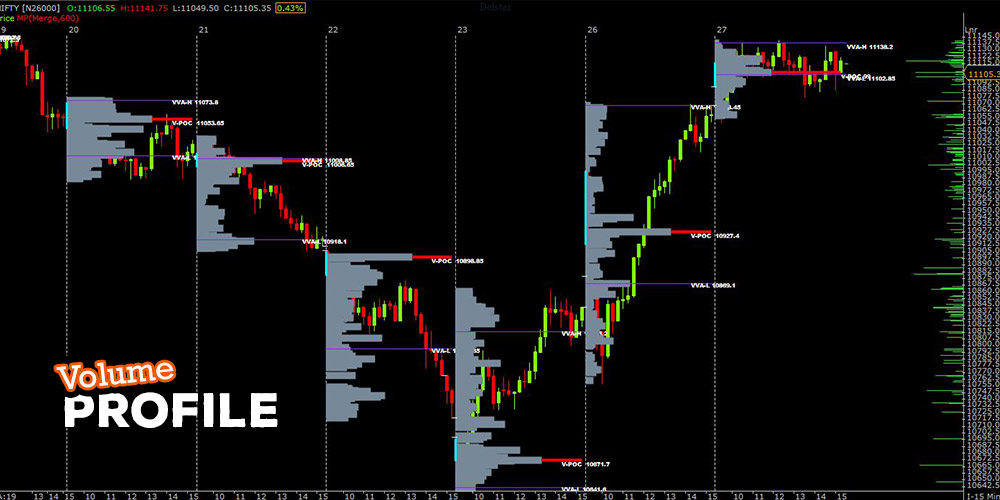
Volume Profile is a visual representation of how much volume occurs at each price over a certain period. It helps traders to identify support and resistance. By looking at volume we can see where the most activity is taking place historically.
This is used to identify Support and Resistance. Volume Profile also includes High volume nodes (HVNs) where prices are deemed as fair prices. These are the prices where traders spend most of their time. HVN attracts market activity. In contrast to HVNs, where prices are deemed as unfair prices are known as Low volume nodes ( LVNs), at these prices, traders spend no or little time. LVN tends to reject market activity.
The Volume Profile takes account of the total volume traded at a particular price level during the specific duration and divides the total volume into either “buy volume” or “sell volume”. This makes it easier for the trader to understand the information.
The first and most important use of the Volume profile is to find basic support and resistance levels. It is a reactive method to identify support and resistance. This means the method relies on past price movements and volume behavior unlike proactive methods (such as trend lines and moving averages) which are based on current price action and analysis to predict future price movements. It can also help apply meaning to price levels that the market has visited earlier.
Volume Profile is an exceptionally valuable tool for technical analysis for traders. It is a charting tool that does a variety of things that are helpful while trading The data that is provided by Volume Profile is quite certain. While in its simplest form, it is a great reactive method for analyzing and finding traditional support and resistance areas. It is capable of comparing a real-time event (the current day’s open) with historical events (the previous day’s profile) and making the best decision based on the connection of the two.
Welcome to our blog!
This blog is a collaborative effort and was compiled by multiple members of the TrueData Team
Simply good post
Thank you for appreciating our work Sir! Such encouraging words motivate us to provide more informative and quality content.
please share tips how can i volume profile indicator
To use the Volume Profile indicator, traders can look for price levels where most trading happened. These are strong support or resistance zones. Traders can use it on NSE stocks or indices to see where buyers or sellers are most active and plan entries or exits. We hope this resolves your query. You can also reach us at [email protected] for your specific queries
Nice blog!
Glad you like our work! Watch this space for more quality content on TrueData!
Interesting. can someone explain when to use Volume Profile in intraday vs long-term charts?
In intraday trading, Volume Profile helps spot key price levels for quick entries and exits, while on long-term charts, it shows major support and resistance areas where big buying or selling happened over time. We hope this resolves your query. Stay tuned for more informative content on TrueData!
Good post! I’d love a chart example showing how traders use POC or value areas in real trading
Traders use the POC and value area to identify high-activity price zones, and watching how the price reacts there can help spot support, resistance, or possible reversals, similar to tracking 'hot spots' of demand and supply. We hope this resolves your query. You can also reach us at [email protected] for more details on the topic.
Good Blog
Thank you, glad you like our post! Stay tuned for more interesting posts on TrueData!
Hello, i found this blog more helpful. It's such an informative article. Adding a few chart screenshots with Volume Profile levels marked would make the concepts easier to understand for beginners.
Thank you for your kind feedback! We are glad you found the article helpful. Adding chart screenshots with key Volume Profile levels marked is a great suggestion, and we will include it soon.
Excellent overview of market structure using Volume Profile. A few more examples of trade entries and exits based on volume zones would make the article even more practical.
Thank you for your valuable feedback! We are glad you found the explanation of Volume Profile and market structure useful, and we will work on your suggestion soon!
Informative Post
Thank you for your kind words! We're glad you found the post informative. Stay tuned for more insightful articles and market-focused content.
Hi Good. It would be great to see a follow-up post with real NSE stock or Nifty examples.
Thank you for your valuable suggestion! We are glad you found the article helpful. We will certainly consider covering this in a follow-up article. Thank you for your continued support and engagement. We truly appreciate it!
Thanks for sharing such valuable content on Blogger. Please also cover how Volume Profile works alongside VWAP or Market Profile.
Thank you for reading our article on Blogger! We are glad you found the content valuable. Volume Profile, VWAP, and Market Profile complement each other but serve different purposes. While Volume Profile shows where the highest trading activity occurred at different price levels, VWAP helps identify the average traded price during the day, and Market Profile focuses on how much time the market spends at each price level. Exploring how these tools work together can help traders make more informed trading decisions, and we will certainly cover this in our future posts. You can also check out our blog on each topic for more insights (https://www.truedata.in/blog/what-is-vwap-volume-weighted-average-price-in-trading) (https://www.truedata.in/blog/what-is-market-profile).
This blog helped clear up several doubts I had about using Volume Profile in intraday trading. Looking forward to more advanced trading strategy articles.
Thank you so much for your kind feedback! We are delighted to hear that the article helped clear up your doubts about using Volume Profile in intraday trading. We will definitely continue publishing more advanced articles on technical concepts to help traders make more informed decisions. We truly appreciate your support and wish you happy investing and trading!
As a truedata API subscriber, I am trying to do some volume analysis. A quick question on that front. When i get trade_callbacks from TD websockets, is LTP and TTQ sycnronized? I.e they both comes from event occured at exact same time (same packets from exchange) and there is no misalignment between them in terms of time? This is very critical for my analysis because one of the Broker vendor's data is misaligned as listed below. Volume Didn't change but LTP changed(LTP and TTQ are time misaligned) . This is of broker's Nifty immediate fut, Aug 2026. However, same i haven't encountered with truedata ws but need some technical confirmation if truedata sends LTP, TTQ and ATP as a time synchronized trade packets from exchange 3rd party broker's misaligned data for ref last_price last_traded_quantity average_traded_price volume_traded change in volume 24629 65 24647.92 1370070 24628.9 65 24647.91 1370330 260 24629 65 24647.91 1370330 0 24629 65 24647.91 1370395 65 24629 65 24647.91 1370395 0 24629 65 24647.91 1370395 0 24621 65 24647.91 1370395 0 24626 130 24647.91 1370395 0
For TrueData WebSocket trade_callback data, the LTP, TTQ (Last Traded Quantity), and ATP (Average Traded Price) are part of the same trade event/update received from the exchange feed and are not independently sourced or time-shifted values. Accordingly, when a trade update is received, the corresponding LTP and traded quantity are processed together, with the trade volume updated based on the respective trade event. TrueData does not intentionally introduce any misalignment between these fields, and the LTP, TTQ and ATP provided in a trade callback are intended to remain synchronized. For more clarity on the technical behavior, please email us at [email protected] with a few relevant snippets/examples for our reference, and our technical team will review them and get back to you with further clarification.
Successful trading is not just about tracking price movements but also about und...
Have you seen a stock rising for quite some time and then suddenly pausing or re...
The world of trading is like a maze with a constant race to find the optimum tra...
We received your signup entry.